Analyse
Overview Tab
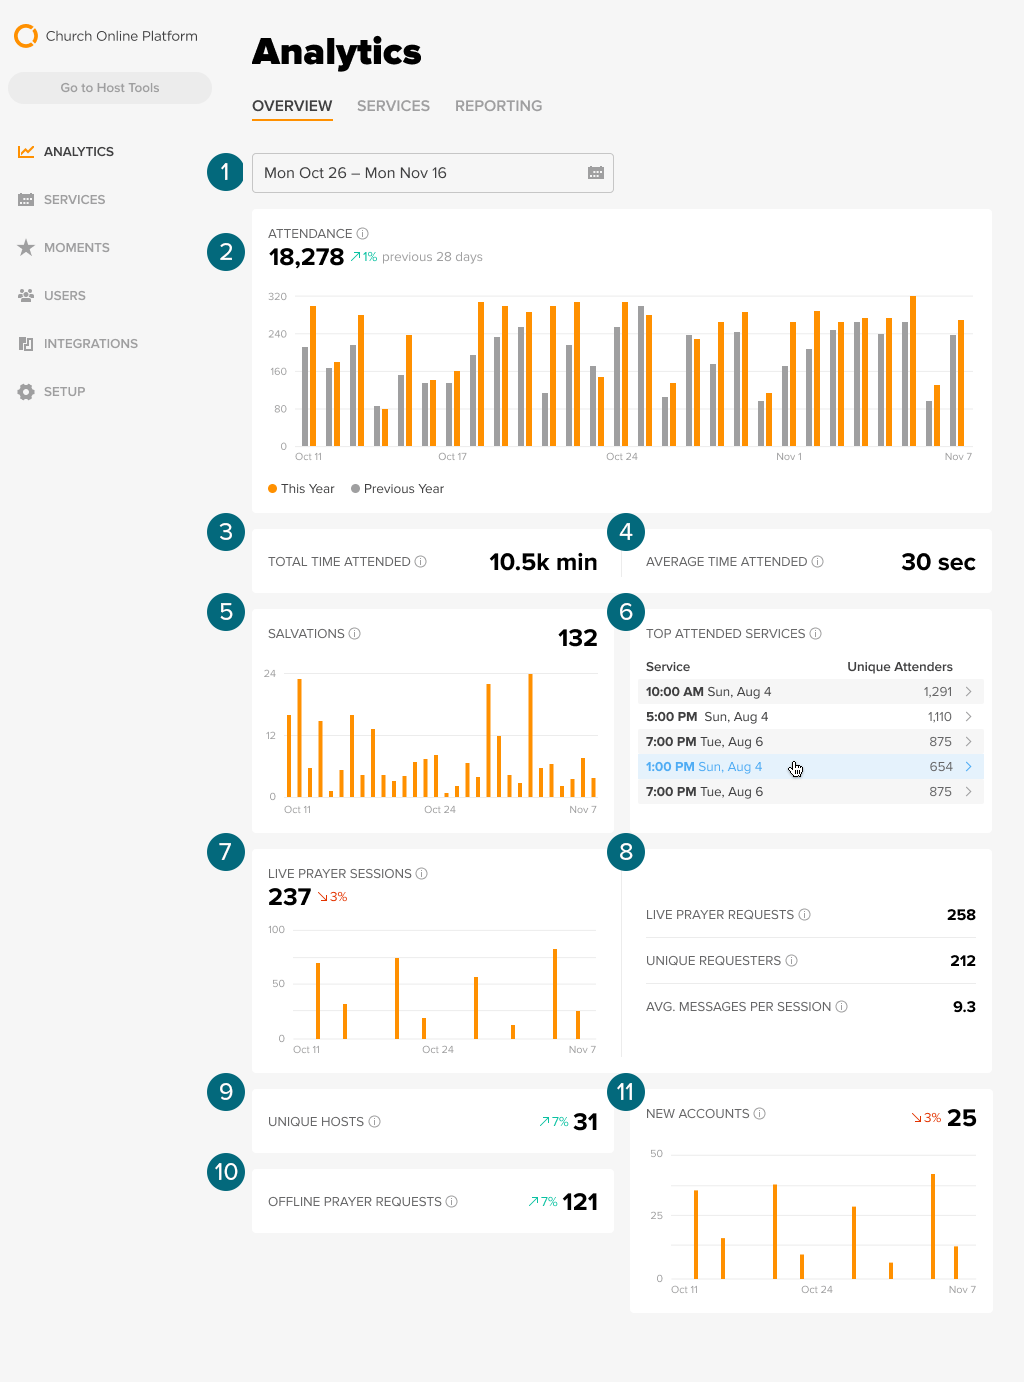
The analytics overview allows you to select a timeframe to see service data within those selected dates.

- Date Picker: select the timeframe you would like to view data from.
- Attendance: the number of unique web browsers that loaded the page during a service during the selected timeframe.
- Total Time Attended: the sum of time attended by all attenders across all services during the selected timeframe.
- Average Time Attended: the average time each person attended across all services during the selected timeframe.
- Salvations: the number of attenders who clicked the salvation moment across all services during the selected timeframe.
- Top Attended Services: services with the highest number of attenders during the selected timeframe.
- Live Prayer Sessions: the number of live prayer sessions between a host and a guest during the selected timeframe.
- Live Prayer Requests: the number of prayer requests received during the selected timeframe.
- Unique Requesters: the number of unique attenders who requested live prayer during the selected timeframe.
- Average Message Per Session: the average number of messages per live prayer session during the selected timeframe.
- Unique Hosts: the total number of unique hosts at all services during the selected timeframe.
- Offline Prayer Requests: the number of non-live prayer requests received during the selected timeframe.
- New Accounts: the number of users who have signed up for an account during the selected timeframe.
Services Tab

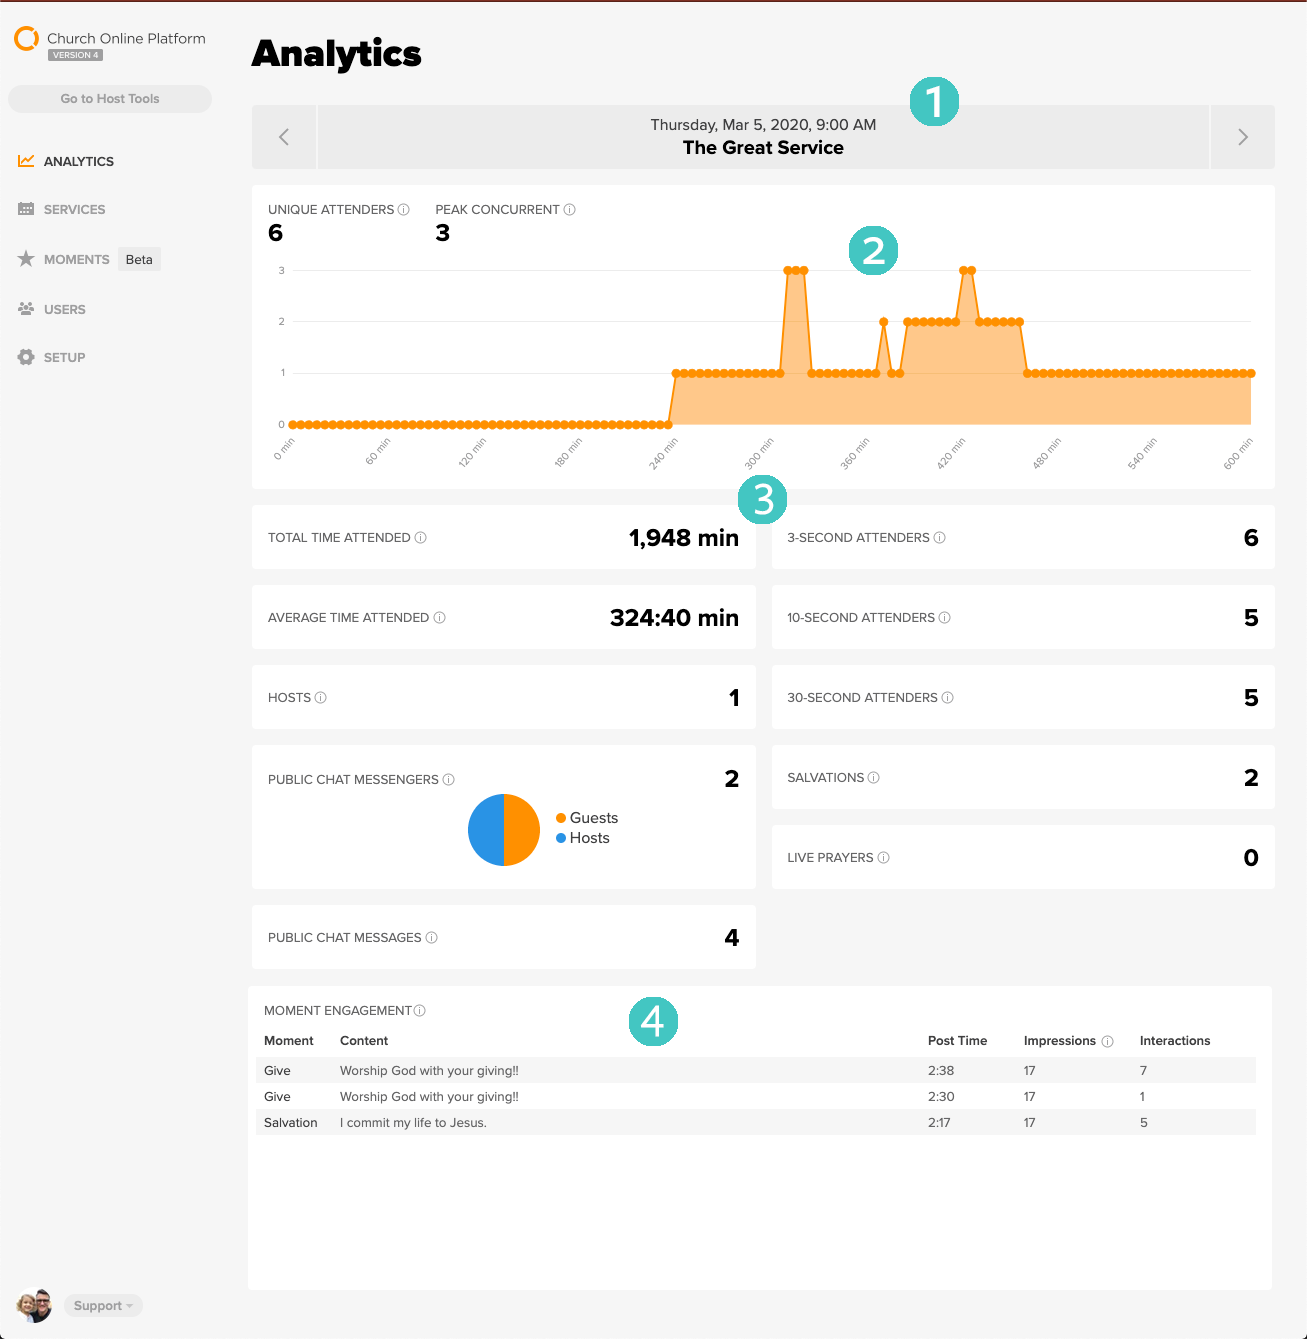
- Service Information: displays Service Information such as date, time, and title. A user can toggle between services utilizing the arrows.
- Graph
- Unique Viewers: the amount of unique web browsers that have at least loaded the page for this Service.
- Peak Concurrent: the highest amount of concurrent attenders during this Service.
- Graph: shows how many people were represented within the service at any specific time. Ex: there were around 15 people within the above service at the 30 minute mark.
- Service Data
- Total Time Attended: the sum of all attenders’ time spent on your site during this Service.
- Average Time Attended: the average of all attenders’ time spent on your site during this Service.
- Hosts: the amount of hosts who were at the Service for longer than 1 minute.
- Public Chat Messengers: the amount of unique attenders and hosts who posted at least one message in the Public chat feed.
- Public Chat Messages: the total amount of chat messages posted in the Public chat feed during this Service.
- 3-second Attenders: the amount of unique attenders who were present for at least 3 seconds during this Service.
- 10-second Attenders: the amount of unique attenders who were present for at least 10 seconds during this Service.
- 30-second Attenders: the amount of unique attenders who were present for at least 30 seconds during this Service.
- Salvations: the total number of times the Salvation Moment was interacted with during this Service. Attenders cannot tap the button more than once per time the Moment is posted.
- Live Prayers: the amount of live prayer sessions involving a guest and a host.
- Moments Engagement Data
- Table: displays the Moment Type, the Content of the Moment, the time in the Service when it was posted, the amount of Impressions, and the amount of Interactions.
- Impressions: the amount of web browsers present in the Service at the time the Moment was posted.
- Interactions: the amount of times the Moment button was clicked (e.g. "Give" for the Give Moment and "Raise Hand" for the Salvation Moment).